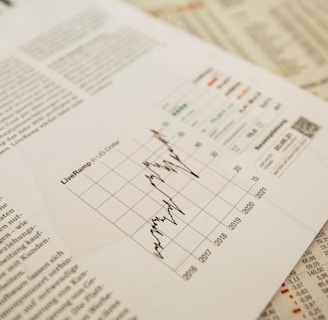
Transform Your Financial Data Visualization

Harness technology for intuitive and impactful financial insights.

Dynamic charts for real-time analysis.

Instant reports for quick decision-making.

Visual assets that enhance communication.

A modern office workspace with a large screen displaying dynamic financial charts.
A close-up of a hand interacting with a digital tablet showing financial data visualizations.
A team of professionals collaborating over a laptop with financial graphs on the screen.

Innovative Financial Solutions

Transforming financial data visualization with cutting-edge technology for smarter decision-making.

A professional team collaborating over digital financial charts on a large screen.
A close-up of a laptop displaying dynamic financial graphs and reports.

Our Services

Explore our innovative solutions for transforming financial data into visual insights.

A modern office workspace with professionals analyzing financial charts on large screens.
A close-up of a digital tablet displaying colorful financial graphs and data visualizations.
Data Visualization

Transform complex financial data into clear, intuitive visual assets for better understanding.

Dynamic Reporting

Instantly generate reports and marketing materials to enhance client communication and analysis.

Transform Your Financial Data

Unlock insights with our visualization solutions

A modern office space with professionals collaborating over financial charts.

Gallery

Explore our innovative financial visualizations.

A close-up of a digital tablet displaying colorful financial graphs.
An abstract representation of data flowing through a network.
A team meeting with a large screen showing dynamic financial data.
A serene workspace with a laptop and financial reports on a desk.
A vibrant infographic illustrating key financial metrics.